

Imagine a world where complex sales data transforms into a captivating story, revealing hidden trends, illuminating customer behavior, and igniting sales strategies. This is the power of sales data visualization. In today’s data-driven world, it is no longer enough to simply possess data; the key lies in transforming it into actionable insights that drive success.
From Data Deluge to Discovery: Why Visualize Sales Data?
- Simplifying the Complex: Visual representations make complex data easier to understand and interpret, allowing for faster decision-making.
- Identifying Trends and Patterns: Visualizations reveal patterns and trends that might remain hidden in spreadsheets, leading to improved forecasting and planning.
- Enhancing Communication and Collaboration: Compelling visuals engage both internal and external stakeholders, facilitating better communication and collaboration.
- Boosting Sales Performance: Data-driven insights derived from visualizations guide strategic decision-making, optimize sales processes, and ultimately drive sales growth.
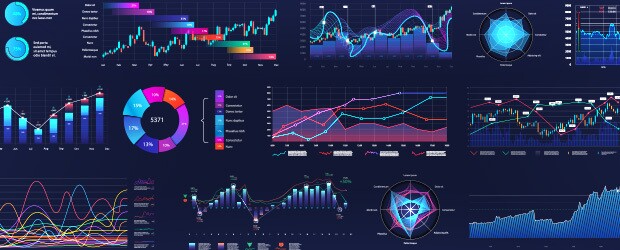
A Canvas of Possibilities: Exploring Visualization Techniques
With a diverse array of visualization techniques available, choosing the right one depends on the story you want to tell and the insights you seek. Here are some popular options:
- Bar Charts: Simple yet powerful, bar charts are ideal for comparing quantities across categories, highlighting top performers, and visualizing trends over time.
- Line Charts: Perfect for showcasing trends and changes over time, line charts reveal growth patterns, seasonality, and potential correlations.
- Pie Charts: Effective for visualizing data proportions and breakdowns, pie charts provide a clear overview of the distribution of sales across categories.
- Heatmaps: Visualizing trends and variations across multiple dimensions, heatmaps help identify hot spots, high-potential areas, and areas requiring improvement.
- Scatter Plots: Exploring relationships between two variables, scatter plots reveal correlations, identify outliers, and inform targeted sales strategies.

Embracing Technology: Tools for Sales Data Visualization
The technological landscape offers an array of powerful tools to translate your sales data into compelling visualizations. Here are some popular options:
- Tableau: A leading platform for data visualization, Tableau offers robust features for interactive dashboards, storytelling, and data exploration.
- Microsoft Power BI: Integrated seamlessly with Microsoft Office Suite, Power BI provides accessible and user-friendly data visualization tools.
- Google Data Studio: A free and cloud-based solution, Google Data Studio offers intuitive features for creating infographics, dashboards, and reports.
- Zoho Analytics: A comprehensive platform for data analysis and visualization, Zoho Analytics caters to businesses seeking detailed insights and advanced features.
Beyond the Charts: Strategies for Effective Sales Data Visualization
While the chosen tools and techniques are essential, remember that effective sales data visualization requires more than just technology.
- Define your goals and objectives: What story do you want to tell? What insights do you seek?
- Clean and organize your data: Ensure data accuracy and consistency before visualization.
- Choose the right visualization technique: Choose a format that best conveys your intended message.
- Use clear and concise visuals: Avoid cluttering your visualizations with unnecessary elements.
- Add context and provide explanations: Enhance understanding with annotations, labels, and descriptions.
- Share your visualizations and encourage discussion: Utilize your visualizations to spark dialogue and inform decisions.

Unlocking the Power of Data: The Road to Sales Excellence
By embracing sales data visualization, you can unlock hidden insights, empower your sales team, and drive remarkable results. Remember, successful data visualization is a journey, not a destination. Continuously learn, experiment, and adapt your approach to stay ahead of the curve and conquer the ever-evolving sales landscape.
So, embark on this journey today, equip yourself with the knowledge and tools, and witness the transformative power of sales data visualization. Your path towards sales excellence awaits.